What’s the average pay for a speech–language pathologist?
We collect SLP wage data, so you can be better informed. Share your wages too!
Most salary information for speech-language pathologists (SLPs) has substantial inaccuracies and is unreliable. Even data from traditionally trustworthy sources such as the U.S. Bureau of Labor Statistics (BLS) contains calculation mistakes that render it essentially useless for SLPs seeking accurate wage information.
As of late 2025, the only SLP wage data source currently available that's reliable is ASHA's. Our data (below) may be used alongside ASHA's, and will become increasingly useful as it grows. But for now, use our data only to supplement ASHA's wage data.
Where does our wage data come from?
SLPs who voluntarily share it! And the more SLPs who share their wages, the more useful this open-access dataset will become. So please share share your wage data with fellow SLPs.
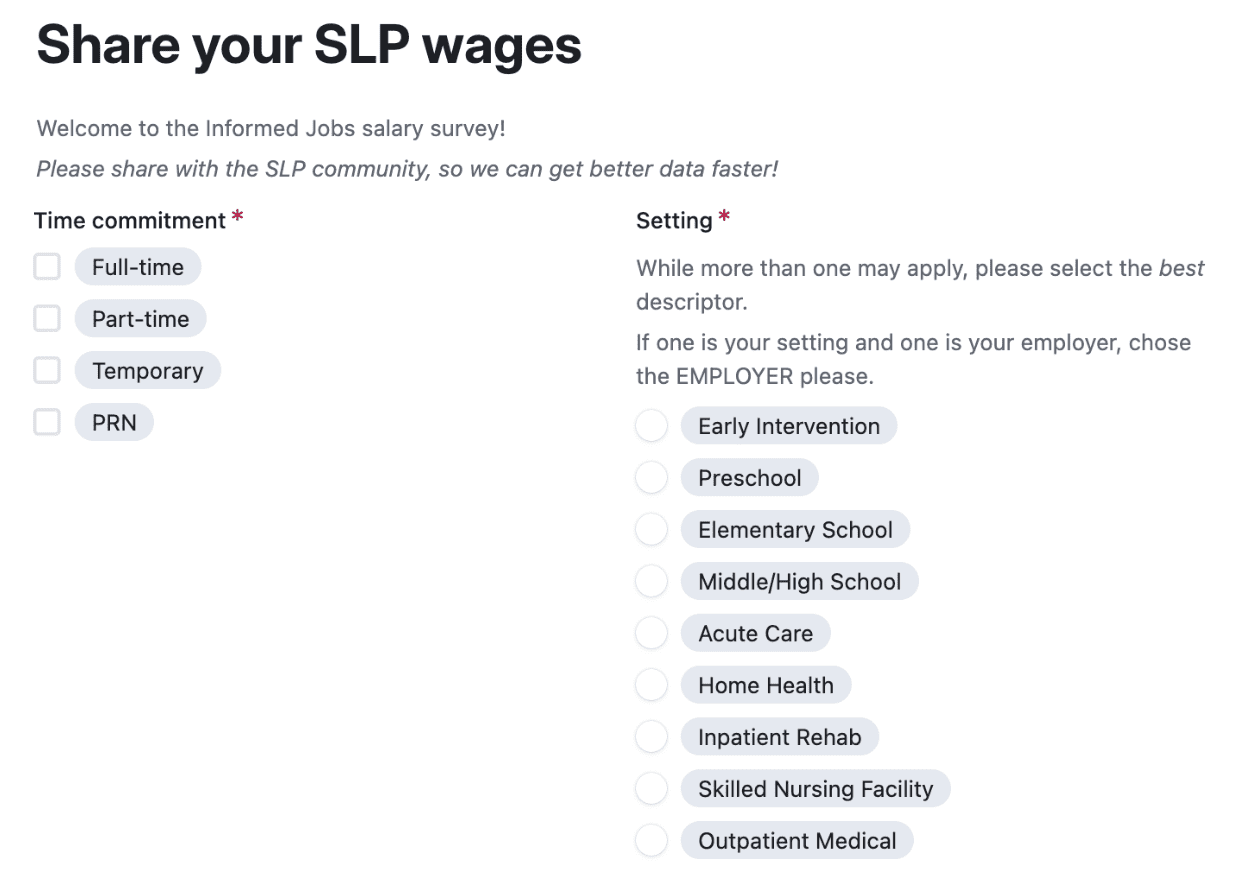
You'll notice that we have a lot of questions in our survey. This is because we noticed that most sites are surveying SLPs incorrectly, leading to false wage data. For example, an hourly rate is not a visit rate, and contract details vary widely. All of our questions aren't just "nice to have" but crucial for ensuring we're representing your pay accurately.
Let's look at the data!
You can read below for key insights or use our data explorer to filter and view parts of our data. At the bottom of that page you may also download our full dataset at any time!
Analyses and description of our dataset:
As of October 15th, 2025, 949 of you provided us with your wage data, which has been incorporated into our data explorer. Below are some select summaries and analyses that you may find useful:
Pay
- Average SLP hourly pay is just under $48.
- This includes all contract types, though, so don’t use it. It’s meaningless. And exactly what’s wrong with the BLS data.
- Why? Well, for example, if you remove W2 hourly rates from the dataset, average 1099 pay is $61/hour. It just isn't helpful to collapse all contract types together. The details matter. A lot.
- This includes all contract types, though, so don’t use it. It’s meaningless. And exactly what’s wrong with the BLS data.
- Average annual pay if you’re salaried = $81,324
- Again, somewhat meaningless because this is across all settings and contract types (e.g. both 9 month school contracts and 12 month contracts).
- Average annual pay if you’re hourly = $84,596
- ***We think this number is wrong, though, and are going to change the way we ask you all this question going forward. We think it’s skewed by some of you reporting that you’re paid “full-time” year-round, but experience with hosting jobs tells us a lot of these are probably actually PPV contacts, which makes the true pay reported wrong, and we need to ask slightly different questions to ensure accuracy, which we’ll do going forward!
- Average annual pay for SLPs on pay-per-visit (PPV) contracts = $79,650.
- Note that while SLPs on pay-per-visit (PPV) contracts tend to have the highest hourly wages, they are on average paid for only 27 hours of work per week, even if working 40 hours per week.
- We’ve been screaming this from the rooftops lately, because it’s so important! Example: A salaried full-time job at $40/hour will pay you $83,200/year. But most PPV full-time jobs listed at “$40/hour” actually pay you closer to $54,000. How many times can we say ‘the details matter’?!
- Note that while SLPs on pay-per-visit (PPV) contracts tend to have the highest hourly wages, they are on average paid for only 27 hours of work per week, even if working 40 hours per week.
- Part-time SLPs make higher hourly wages than full-time:
- Part-time, salaried = $54/hour; part-time, hourly = $53/hour
- Full-time, salaried = $49/hour; full-time, hourly = $46/hour
Other, more useful analyses of pay
For both of the following graphs, n = 730, and hourly pay is converted to annual (for full-time only), and annual converted to hourly:

- These numbers above represent the average (mean) annual pay per setting. Overall mean is $80,250, and median is $77,160. Range is $41,206 to $156,000.
- Medical settings (particularly Skilled Nursing Facility at $95,783) tend to offer higher annual pay than education settings.
- Elementary School positions, despite being the most common in the dataset (124 entries), offer below-average salaries at $74,345 (but see the next graph below!!)
- Private Practice settings have the lowest average annual pay at $73,307.
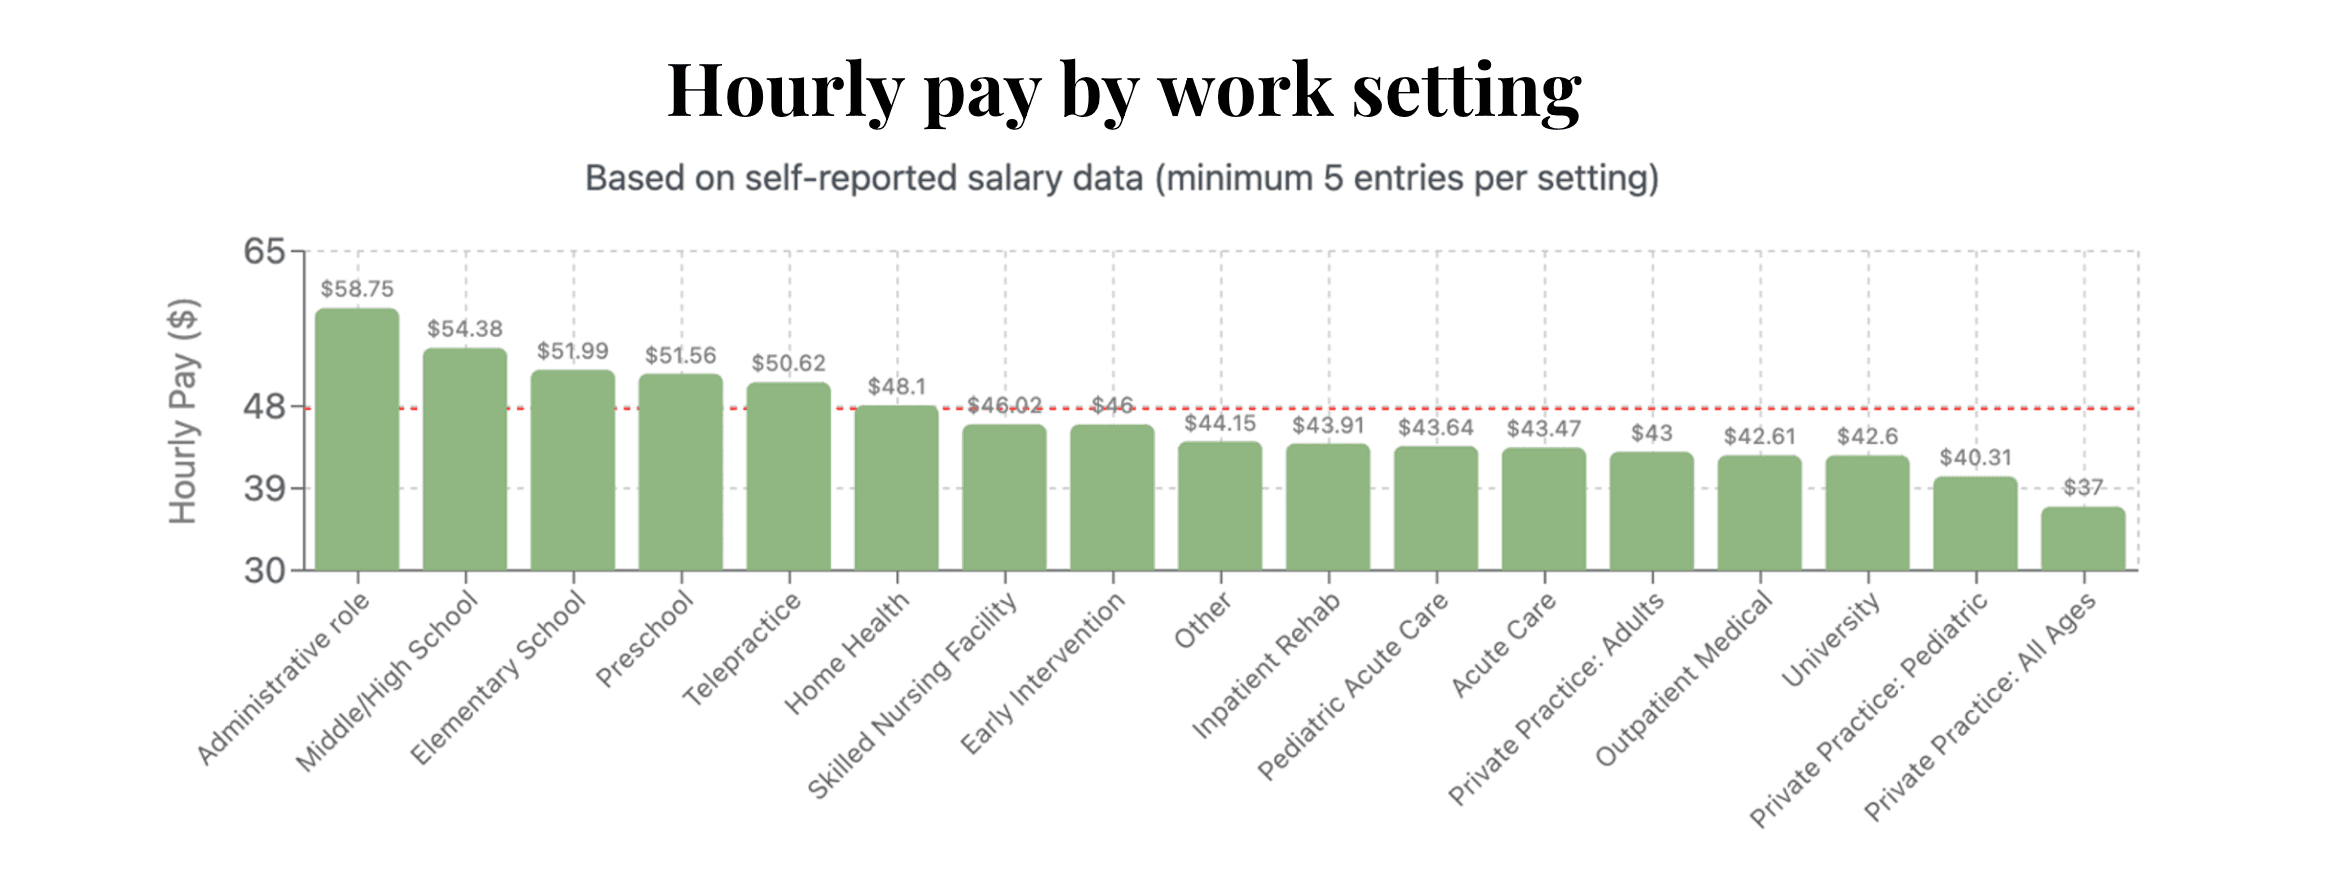
Notice how the "highest paid" jobs if you look at hourly rates are in the schools? And the “highest paid” jobs if you look at annual wages are in SNFs and other medical settings? Think for a second about why that might be…
Good, yes! Contact type. School-based SLPs make less per year but more per hour because they’re only working 9 months. Med SLPs make less per hour but more per year because they’re working 12 months. Hourly and annual rate norms DO NOT carry across setting and contract type very well. The details matter ;)
Pay by years of experience
What if we look at this by years of experience? The following graph includes both hourly pay and annual-converted-to-hourly, to get the clearest picture of what SLPs (n = 730) are making per hour:

And how much does pay change?

The biggest jump is between 2–5 years and 5–10 years. Our prediction is that the ~ 5-year mark is when SLPs get really good at their jobs and get savvier about negotiating pay. But that's just a guess so maybe you have other predictions?
Not shown in this graph, but the pay range also widens as you go up in years. This suggests that the longer you're in the field, the more your pay may vary from peers, whereas new SLPs tend to be paid more similarly.
Note also that we have pretty decent numbers per age group, with 13% of the sample in their CFY, 41% in years 2–5, 27% in years 5–10, 11% 10–15 years, and 7% over 15 years in the field.
Pay by location
While we can’t chart pay by city or zip code (yet!) because our dataset isn’t large enough, we can chart hourly pay by Cost of Living Index (COLI). First Google your cost of living index, then compare it to this chart.

Note that the colors represent different regions based on the first digit of the zip code. There’s also a moderate positive correlation between hourly rate and cost of living (stats come later, with a bigger data set).
- If you're not familiar with Cost of Living index (COLI), this may be confusing. An example: The Informed SLP and Informed Jobs are based in Kansas City. Our COLI = 92, which means it's 8% below the national average of 100. So we can look at the left side of this graph, go to about the "92" level, and see the spread of our hourly wages between $30 and $60. You can't tell the mean from this, but you can see that what we make in Kansas City (pink) is not what people make in California (orange). While all this graph really shows is that location matters, with larger datasets and the calculator we're building you, you can use COLI to predict the exact average, range, and percentiles for your zip code!
- Note also that COLI is better than statewide data, but still imperfect. The best way to calculate will be by zipcode, which is why that's what we're gathering from you. For example: Florida has among the lowest wages of any state for SLPs (due to low reimbursement rates there), but a high cost of living. Whereas Texas has many areas with moderate cost of living, but Texas has among the highest wages for SLPs anywhere in the U.S.
Starting to feel like this wage data would be much more useful with finer levels of detail? Right! The higher our numbers, the savvier analyses we can run. Share your wages here so we can continue to run deeper analyses.
Benefits and stipends:
Two out of three SLPs are employees (W2), and one in three are contractors (1099). Read more here on why that matters.
Those of you who have W2 roles are eligible for benefits and stipends. Here’s what’s common to receive:
- 85% receive health insurance
- 76% have PTO
- 78% have 401K plans or other retirement plans
And for part-timers,
- 14% receive health insurance
- 18% have PTO
- 32% have 401K plans or other retirement plans
And 28% of part-time workers receive no benefits, while only 2% of full-time workers receive no benefits.
Here's a graph of those full-time employee benefits (n = 579):

Note that CE and therapy reimbursements above include those who receive stipends for these, as well. We were actually really happy to see continuing education being reimbursed for 48% of you, and therapy materials for 29%! Remember—contractors (1099) can’t be reimbursed for any of these things.
Other details not included in this graph:
- 13% of SLPs get their CCCs paid for
- Many receive stipends as well. The average dollar value of stipends = $2127. However, five people receive over $7,000 in stipends annually!
Note that negotiating stipends can sometimes be easier than negotiating your hourly rate or salary. Think about what you have to pay for out of pocket, or why you deserve significantly higher pay than average, then request it as a stipend!
How does this compare to ASHA's dataset?
Anything that collapses roles and contract types is pretty meaningless, so we really encourage you to look at ASHA's data, directly!
But for the sake of a few quick answers:
- Median hourly wage across all US-based SLPs, regardless of setting or contract type is just over $40.
- Median annual salary for a 9–10 month school contract = $69,000
- Adjust down if you’re early in your career and up if you’re more experienced. For example, if you’ve worked fewer than 3 years, the median is actually $54,909. If you’ve worked over 28 years, the median is $83,000 (ASHA Wage Data).
- Median annual salary for healthcare SLPs in a year-round contract = $82,000. And median hourly wages for Healthcare or Med SLPs are: $50 for part-time, and $45 for full-time (ASHA Wage Data).
And if you need better local pay information, we wrote an article on that, here.
Now what?
1) Help us provide better wage data by sharing yours here.
2) We'll update this and our Data Explorer regularly, so come back monthly for updated data!
Have questions or feedback?
This data is for you, so please let us know! Email contact@informedjobs.com